Recently, more and more users are using multiple cloud resources to host their applications their corporate resources. According to this situation for multi-cloud systems need a multi-cloud tool for monitoring. One example of such a universal monitoring system could be New Relic. Especially after the last update (to New Relic ONE), which allows you to make monitoring everything from one place.
Get started capturing and analyzing your data with New Relic, not so difficult:
- If you don’t have a New Relic account, sign up at newrelic.com/signup. (can use free tier)
- To see what technologies New Relic can instrument, see newrelic.com/integrations . (the list is large, so better start from working with agents)
- To install an agent now, see Install the agent. (infrastructure agent the best choice, because clouds are different, and operation systems are universal keys to clouds)
After you have data coming into New Relic, learn more about the New Relic user interface. New Relic Documentation is made user friendly, especially search. But for beginning better keep attention on the next milestones, for avoiding confusion.
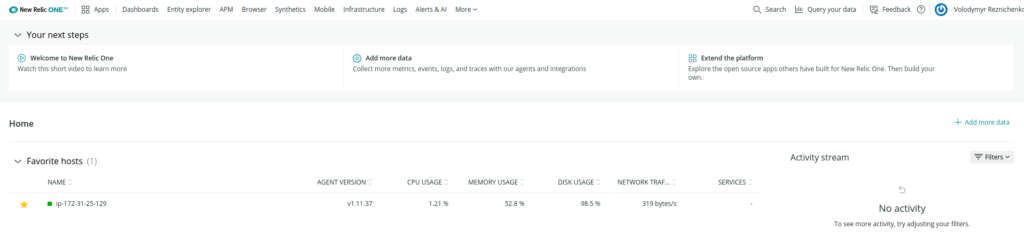
“New Relic ONE gathers all your New Relic data in a single place, in’s the new version of New Relic UI(like ‘all in one’).”
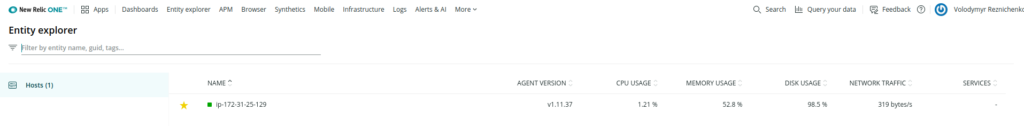
New Relic ONE entity explorer: View performance across apps, services, hosts
“Use New Relic ONE’s Entity explorer to access the performance data from all your monitored applications, services, and hosts.”
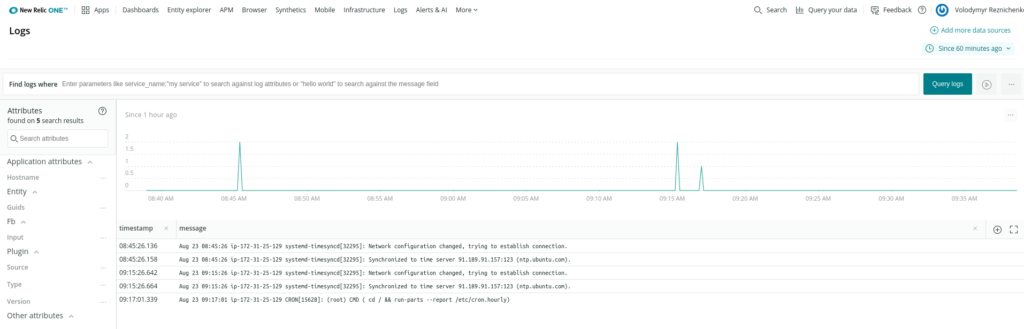
Introduction to New Relic Logs
“New Relic Logs offers a fast, scalable log management platform that allows you to connect your log data with the rest of your telemetry data.”
Introduction to Chart builder / App data NRQL query examples
“With New Relic One Chart builder, you can run queries of your data to create custom charts and other visualizations.”
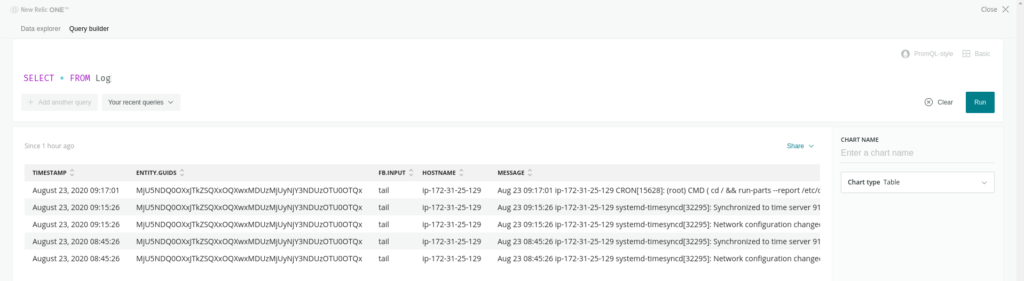
“Just press [Ctrl] + [Shift] + [E] and run your NRQL query.”
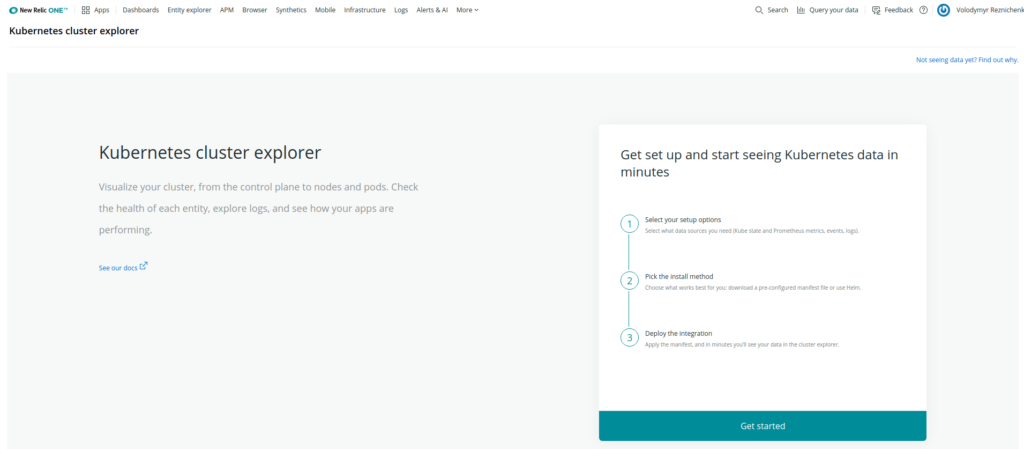
Introduction to the Kubernetes integration
“New Relic’s Kubernetes cluster explorer uses the data collected by the Kubernetes integration to show the status of your cluster, from the control plane to nodes and pods.”
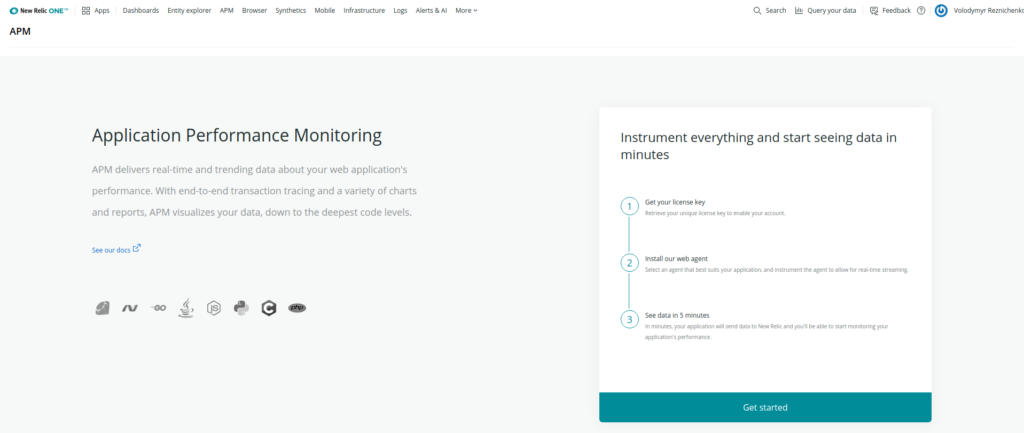
“Application performance monitoring (APM) delivers real-time and trending data about your web application’s performance and the level of satisfaction that your end users experience.”
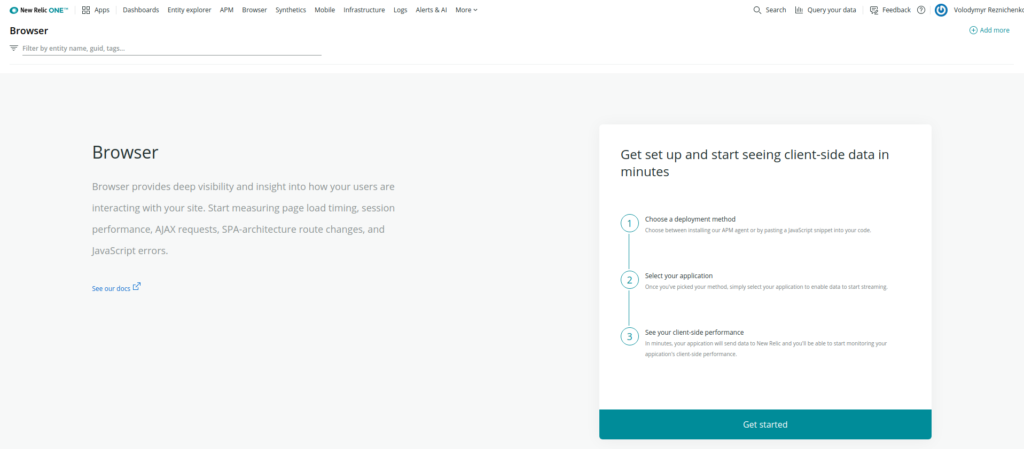
Introduction to New Relic Browser
“New Relic Browser provides deep visibility and insight into how your users are interacting with your application or website.”
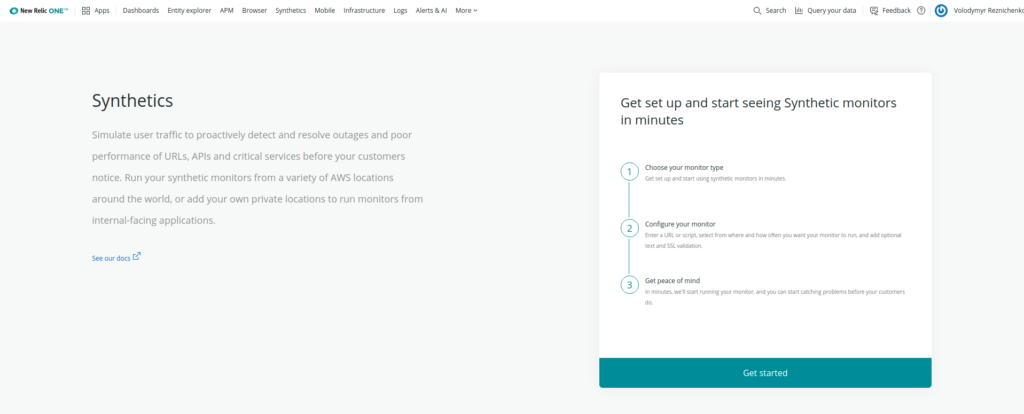
Introduction to New Relic Synthetics
“New Relic Synthetics is a suite of automated, scriptable tools to monitor your websites, critical business transactions, and API endpoints.”
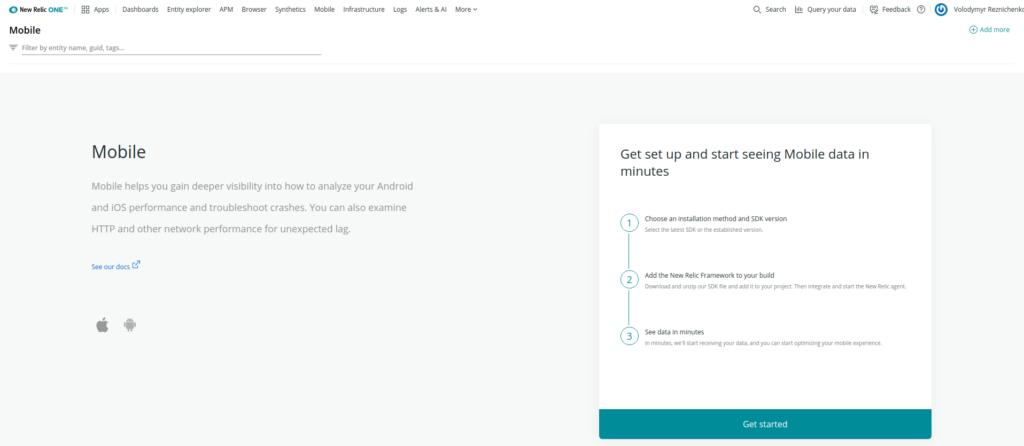
Introduction to New Relic Mobile
“New Relic Mobile helps you gain deeper visibility into how to analyze your Android and iOS application performance and troubleshoot crashes.”
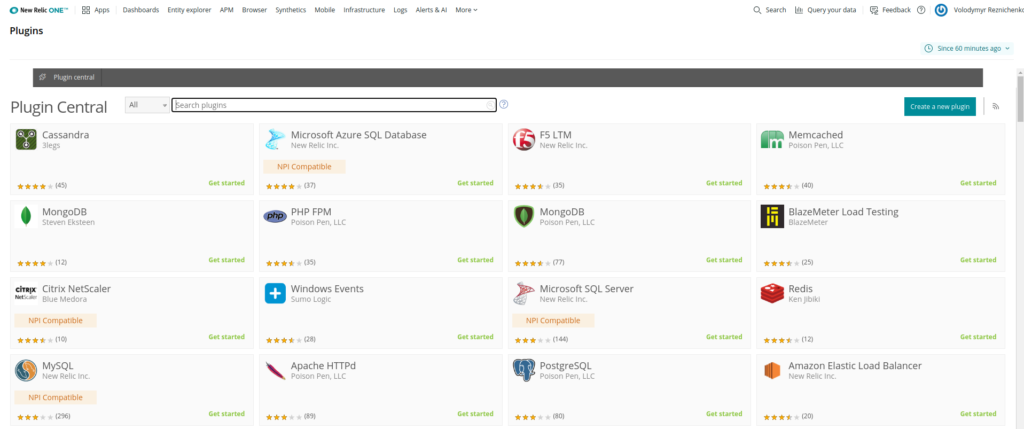
Introduction to New Relic Plugins
“The New Relic Plugins product can publish plugin agents that collect selected metric data.”
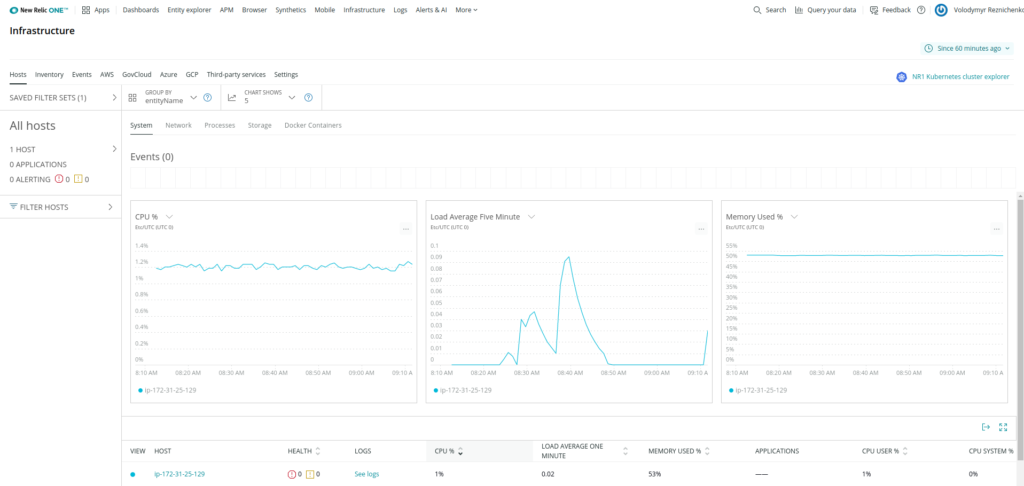
Introduction to New Relic Infrastructure
“New Relic Infrastructure provides flexible, dynamic monitoring of your entire infrastructure, from services running in the cloud or on dedicated hosts to containers running in orchestrated environments.”
Introduction to New Relic Alerts
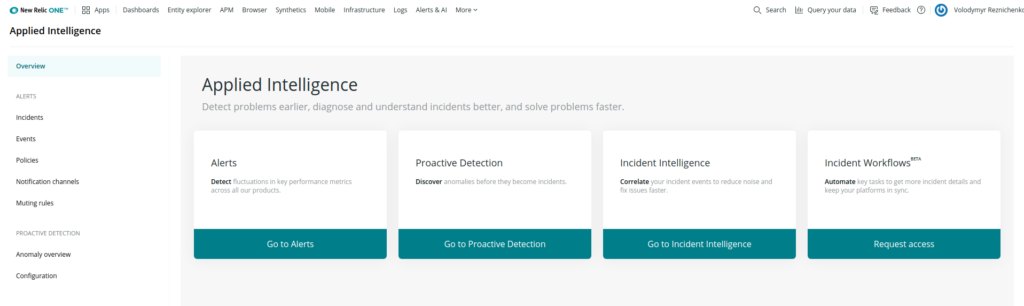
“New Relic Alerts lets you set up robust and customizable alert policies for anything that you can monitor with New Relic. Receive notifications for fluctuations in key performance metrics from across all of our products, including APM, Infrastructure, Browser, Mobile, and Insights.”
So, the above is enough to start overcoming your own monitoring system between different clouds and between different applications but receiving the same types of notifications, metrics, etc.
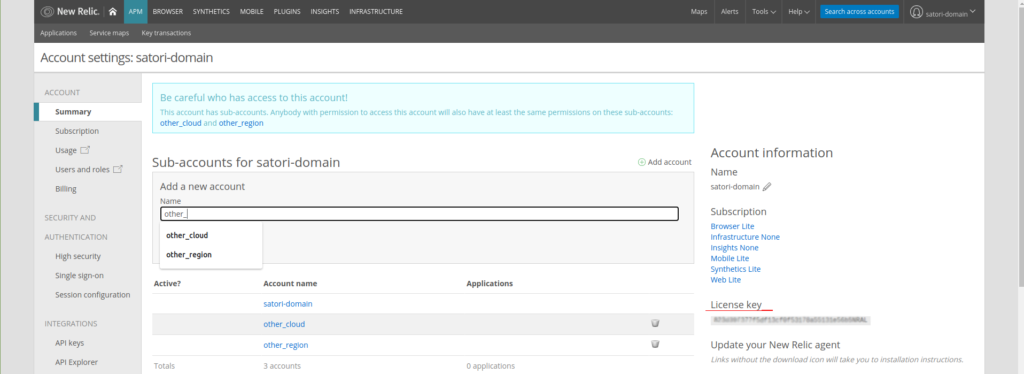
Let’s start with dividing. When we have several different clouds best practice is keeping each kind of cloud or each of the regions in different sub-account. Each subaccount has a different license key, that allows using this key for necessary entities. New Relic ONE can resolve dependencies among subaccounts and manage them together, all in one, but with the different data stream. Also, each subaccount contains its own API key, which allows providing automation differently, without overriding rules among them.
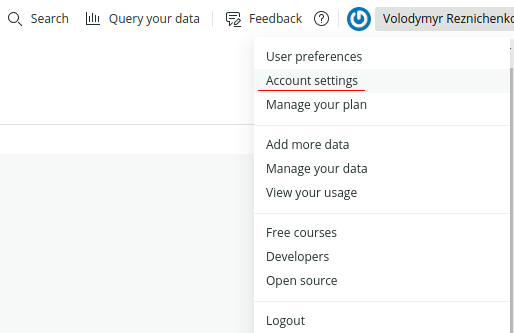
Then just need open Account settings (scroll bar in the right top corner) and create necessary subaccounts:
License keys will use for the installation agents, that will be collected inside the certain subaccounts.
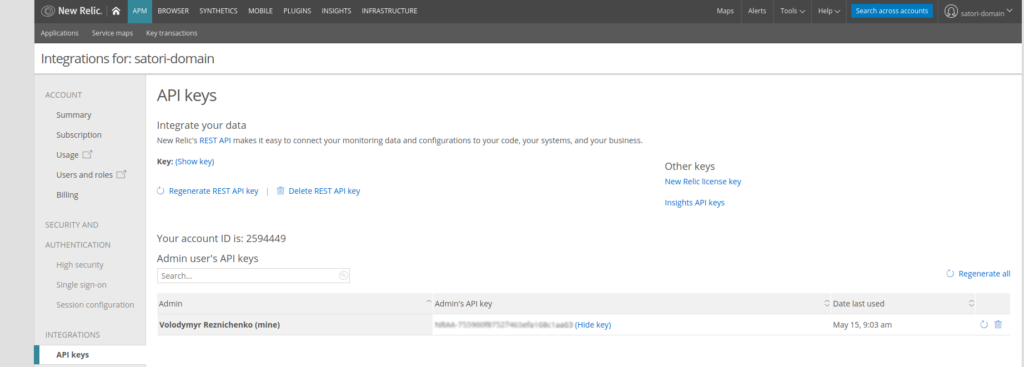
Besides, for working with New Relic API need to generate Admin API keys (this key is used for automation settings using terraform e.g.):
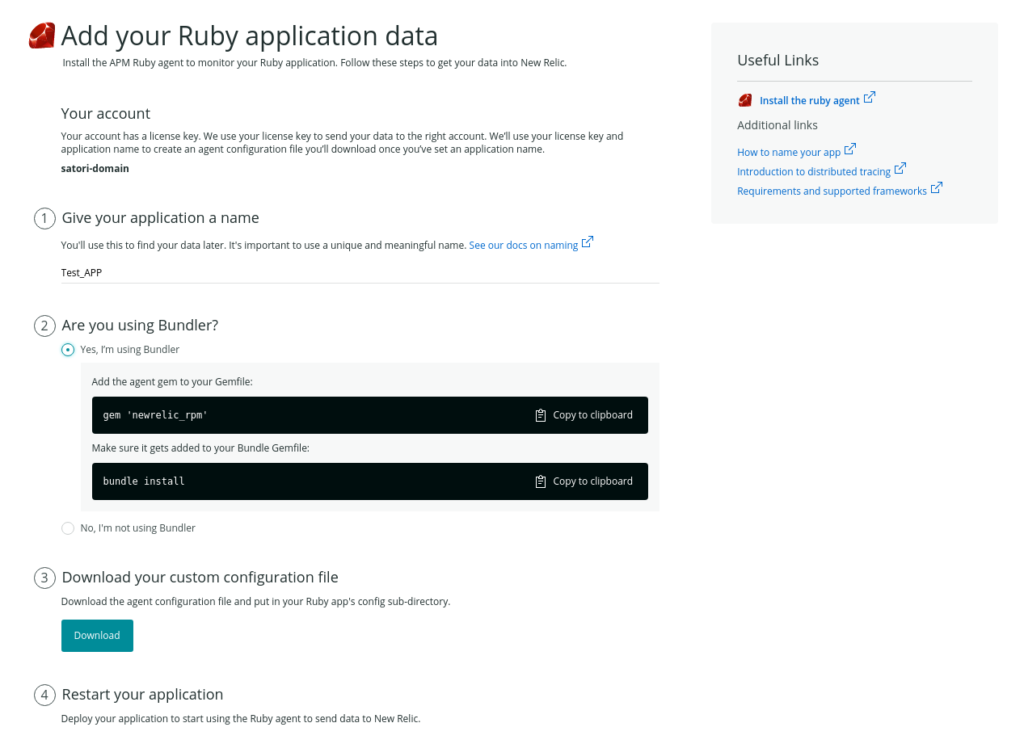
After creation subaccounts and generation keys can start to deploy agents on environments, using spacial wizards for generation deployments configs automatically:
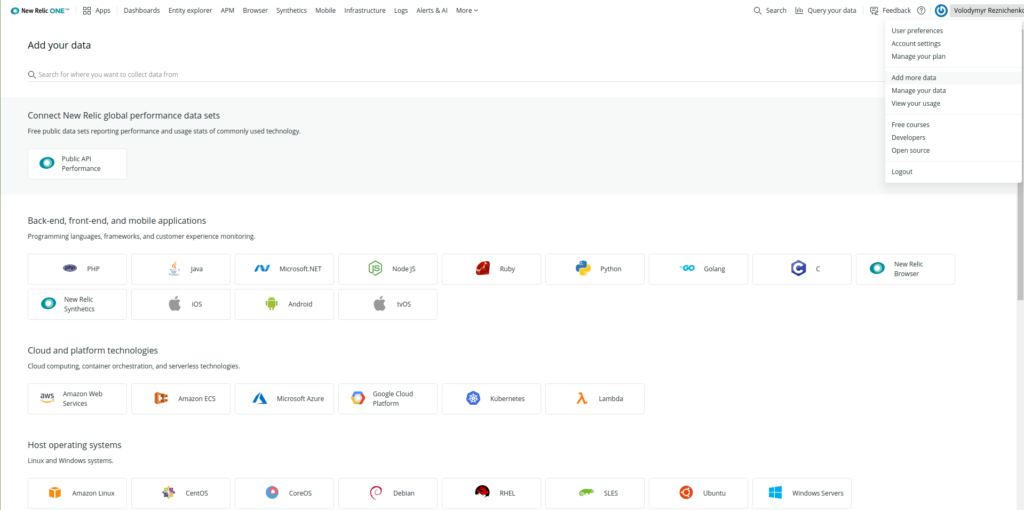
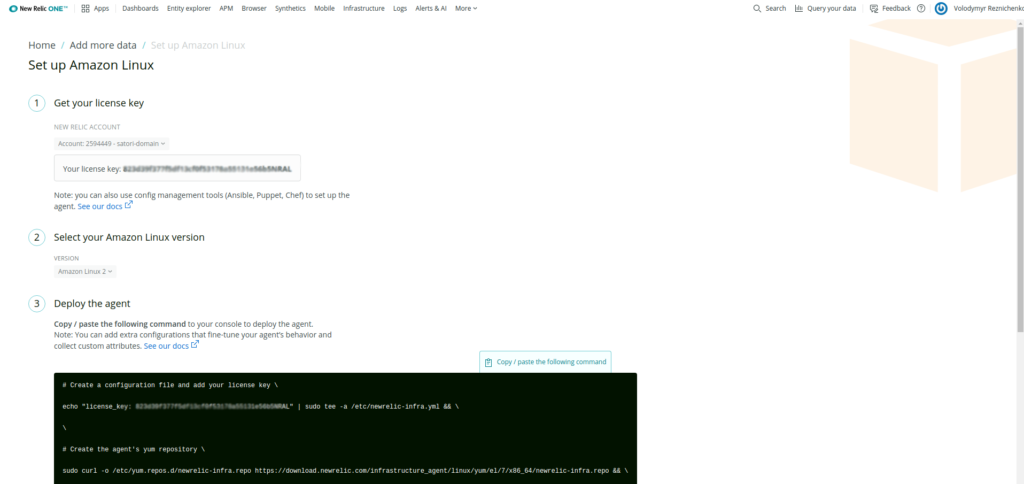
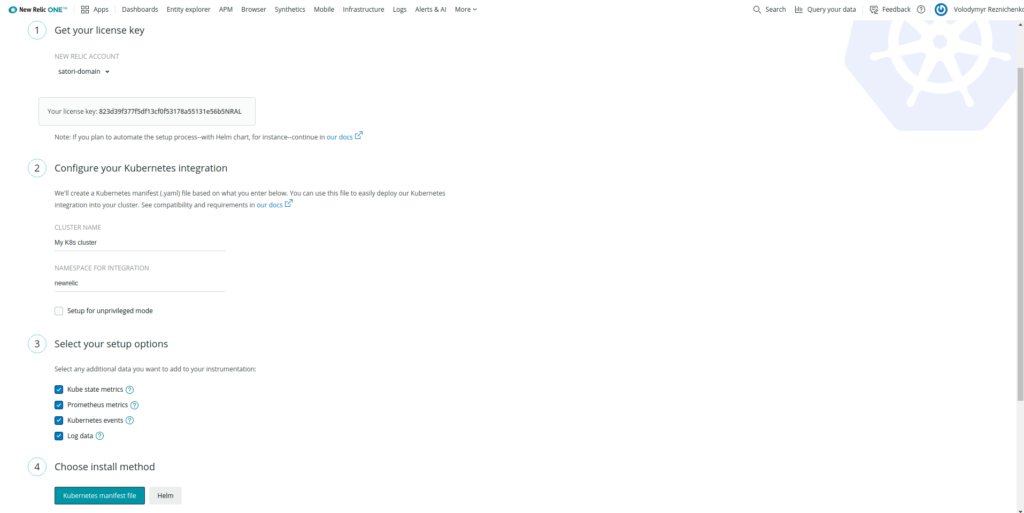
Need to choice necessary platform, fill smile form, and get configurations/scripts/manifests for deploy agents:
(deployments script for Amazon Linux 2 e.g.)
(manifest for Kubernetes cluster e.g.)
(config file for Ruby e.g)
After deploy, agents monitoring appears on certain subaccounts, and also on general New Relic ONE page with subaccount markers. Then can start to set alert conditions, policies, and can bound alerts with notifications on messengers (like Slack e.g.) or e-mail or phone. Although, we are getting metrics from different sources, inside New Relic all of them are collecting and reworking according to unified rules. It is a useful thing especially in large mixed structures and different clouds.
Volodymyr Reznichenko, DevOps engineer, ONYX-Systems, Kropyvnytskyi, 23 Aug 2020.
Onix Internal

This tutorial will guide you in deploying a WP application in Kubernetes using the GitLab repository and a remote server with a MySQL database. Also added a manifest for Kubernetes cron job for data backup to AWS S3 bucket. Create a repository on GitLab Put the source of code of WP site or add folders […]
Onix Internal

The results of Starlink testing at Onix’s office(prepared by the infrastructure administrator) Starlink testing took place on November 28 from 11:00 a.m. to 8:00 p.m. According to statistical data, 180-200 unique IP addresses participating in the testing. During the testing, they downloaded 219 GB and transmitted 39 GB of data. This amounts to 258 GB […]