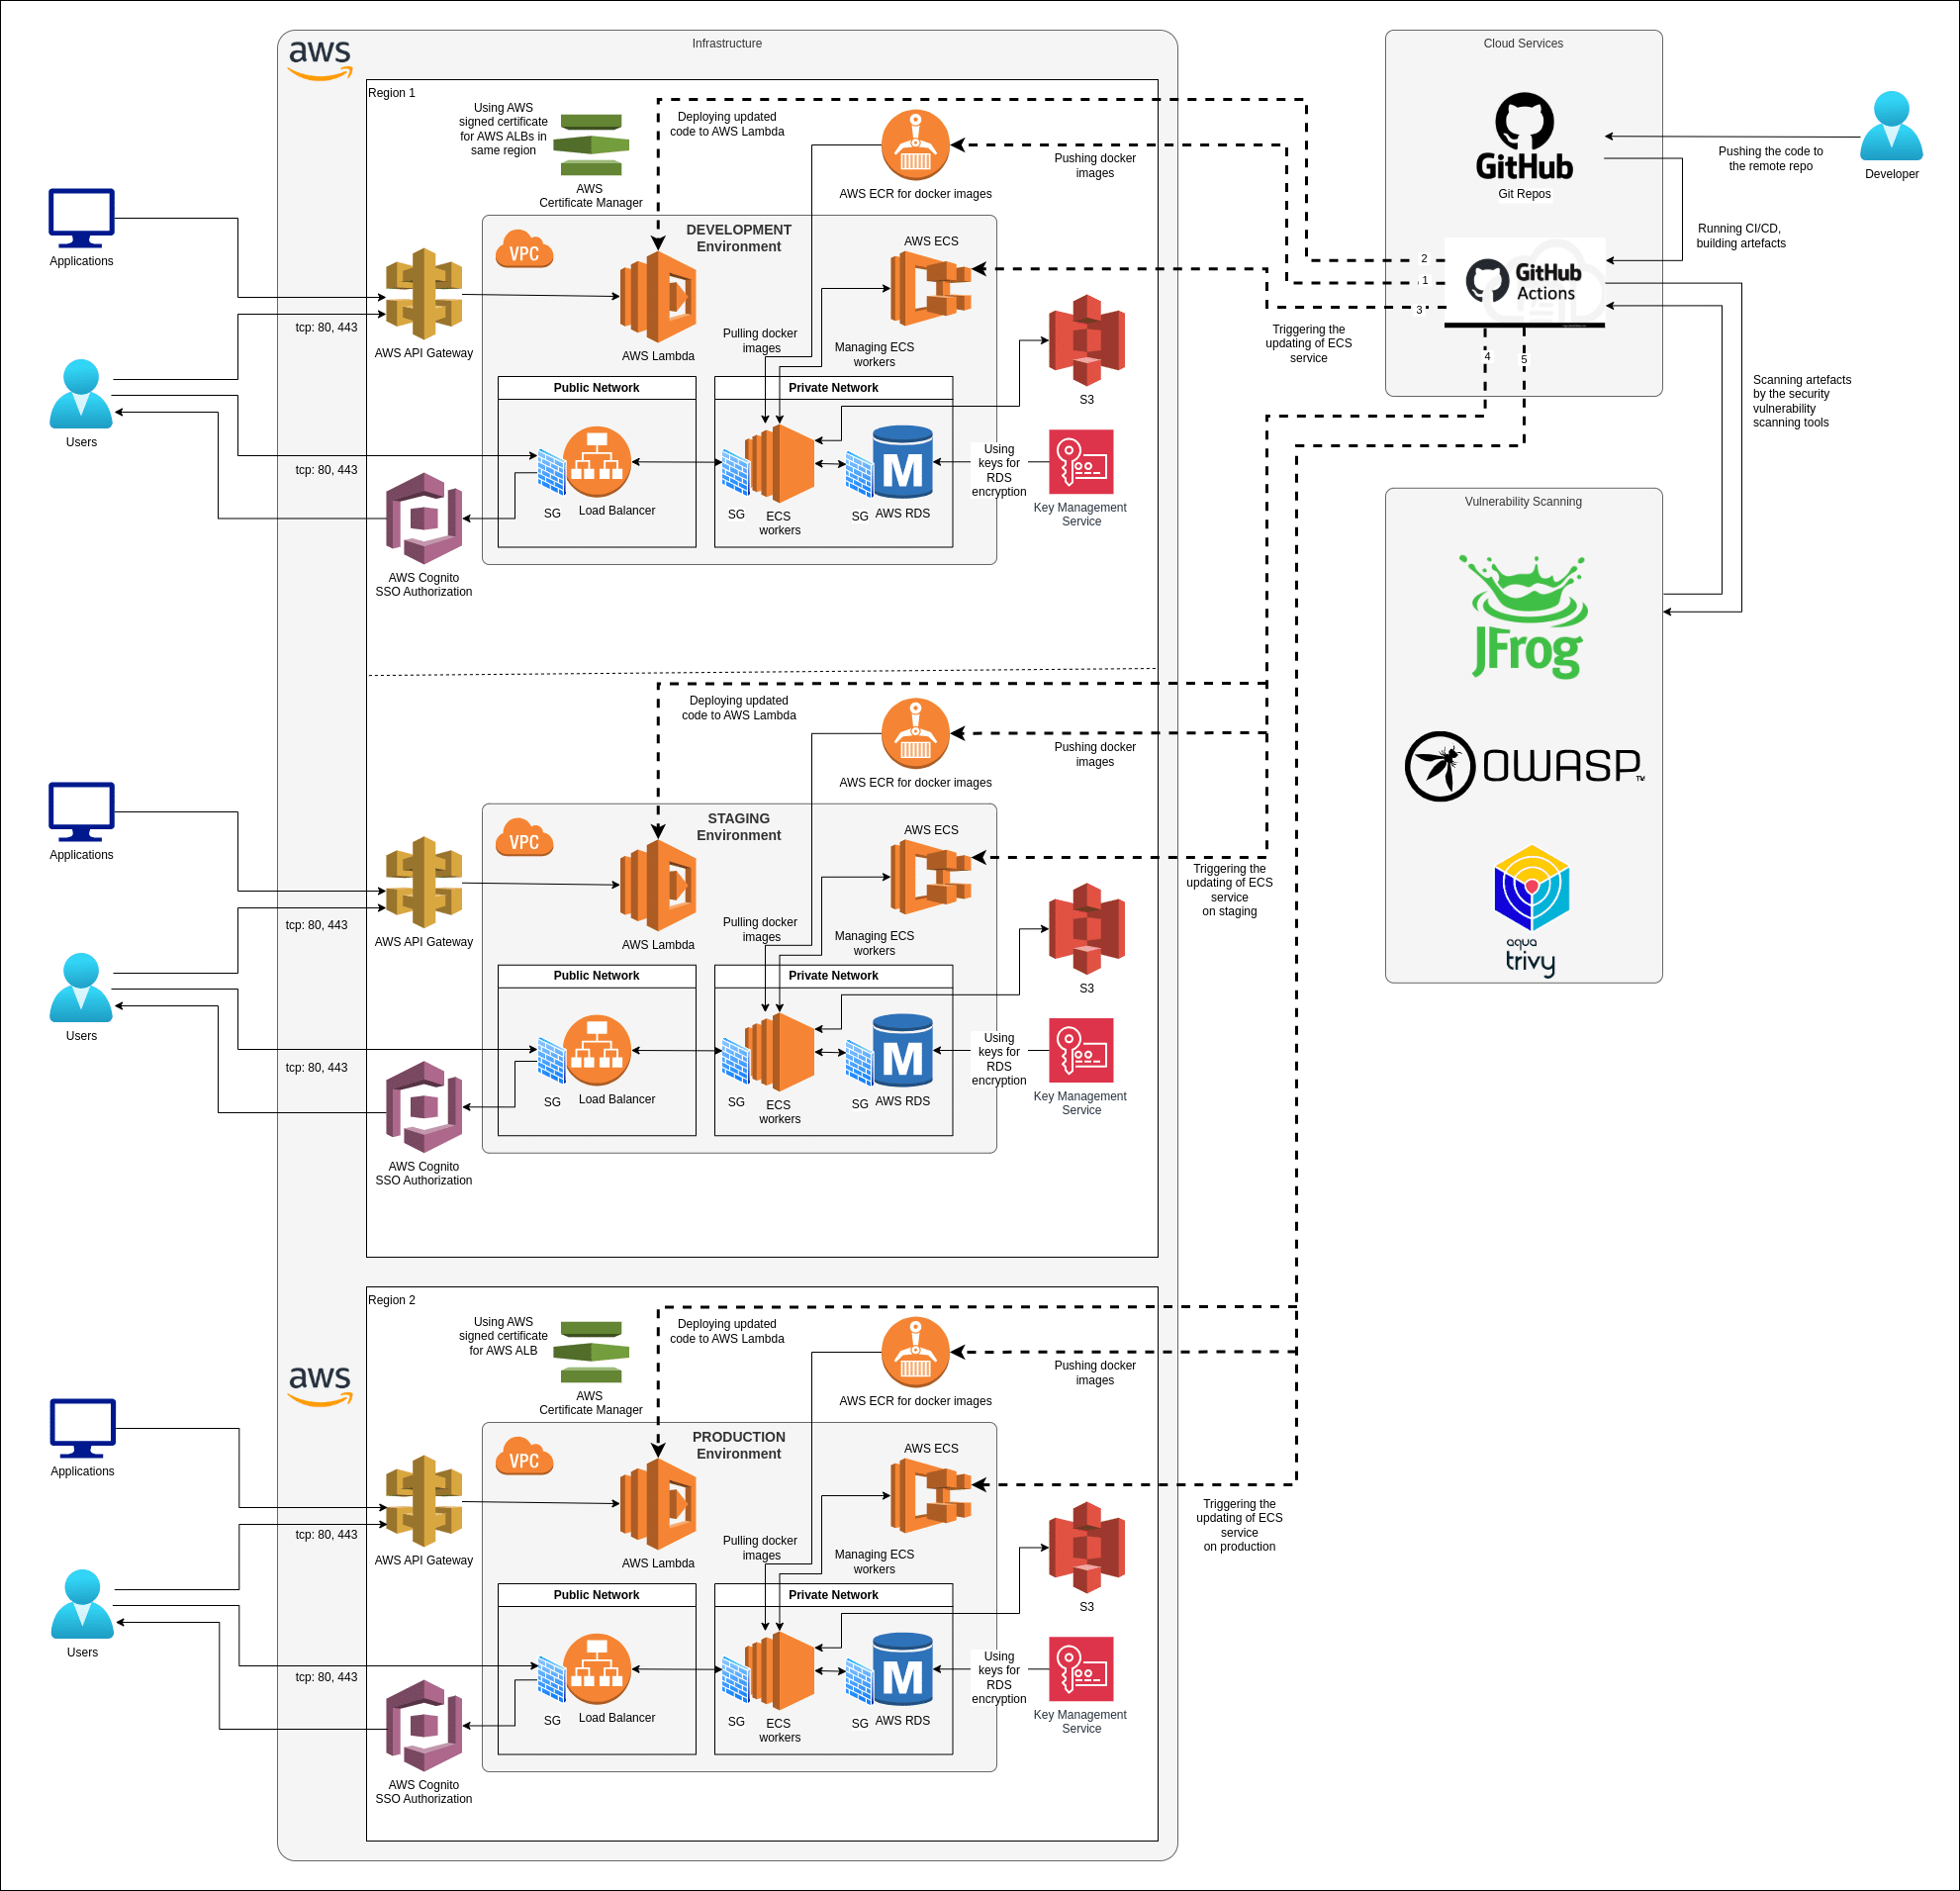
Logging and monitoring on any infrastructure is an essential part of our work.
Here the couple examples what we do.
On some projects, we use a few services from Elastic. It is a scalable infrastructure which consists of dedicated servers, virtual machines with different OS families, services run on docker engine.
Elastic Metricbeat (system/docker module) for gathering Linux/MacOS/Docker services system metrics (CPU, RAM, net, processes, etc.).
Elastic Filebeat for gathering Linux/MacOS services logs.
Elastic Logstash with custom pipelines for receiving/filtering logs/metrics and sending those to Elasticsearch.
Elasticsearch for logs/metrics storage (custom elasticsearch curator service for rotation old data).
Elastic Kibana for logs/metrics visualization; Grafana for metrics visualization.
Ansible for provisioning (including Grafana dashboards).
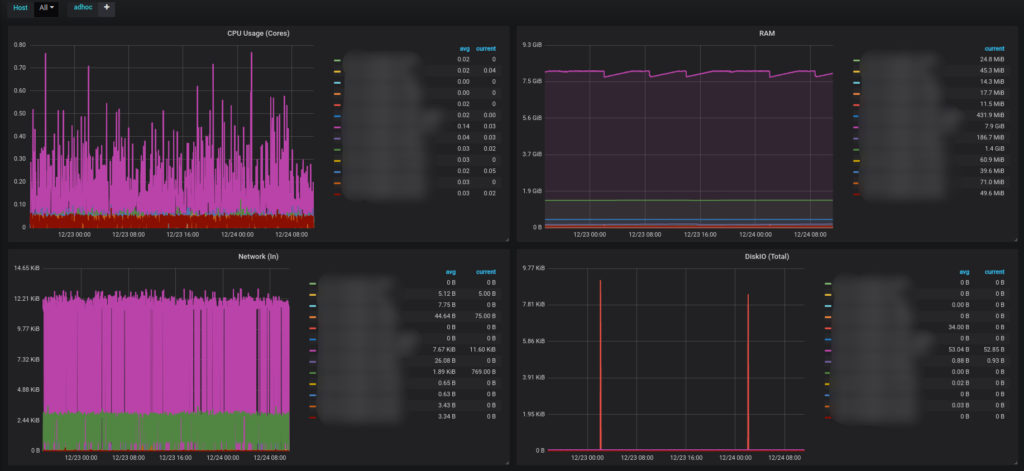
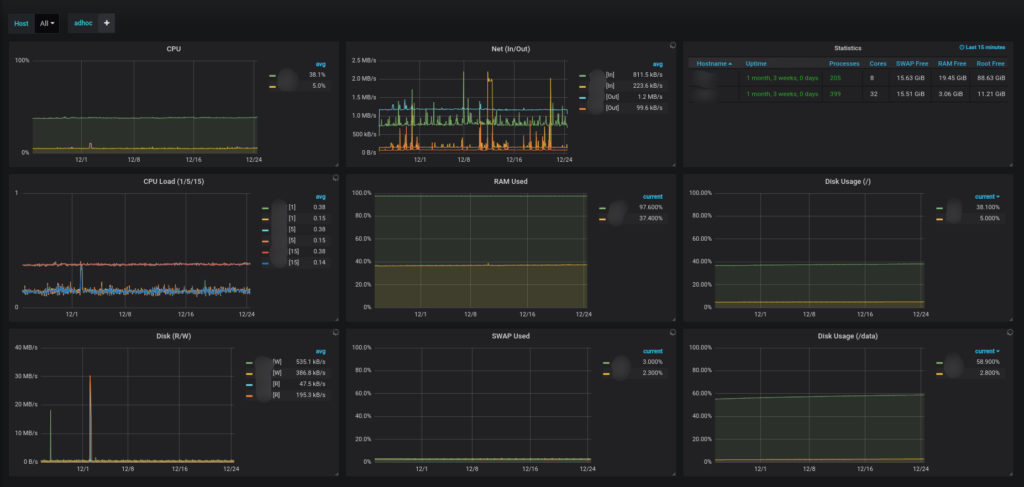
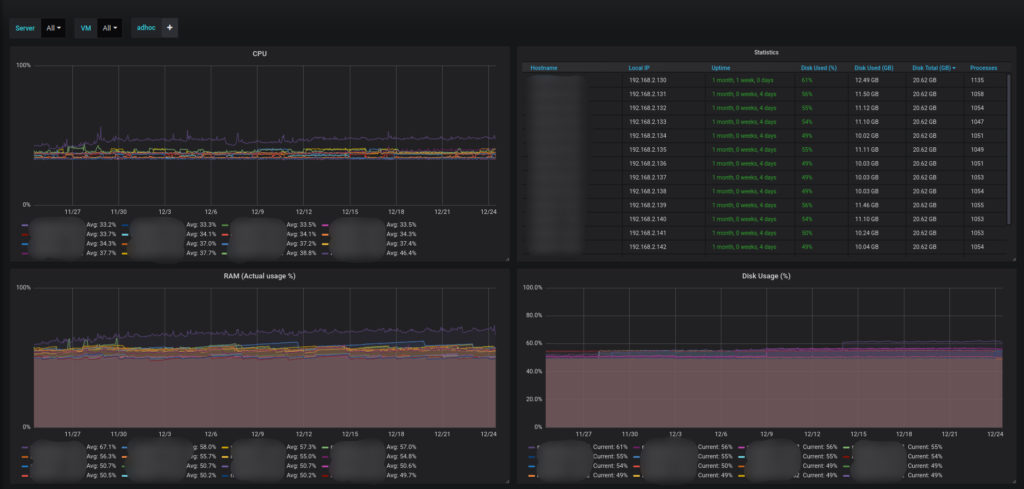
https://onix-systems.com monitoring
Also, have experience with Prometheus (system/docker metrics scrapping and visualization in Grafana)
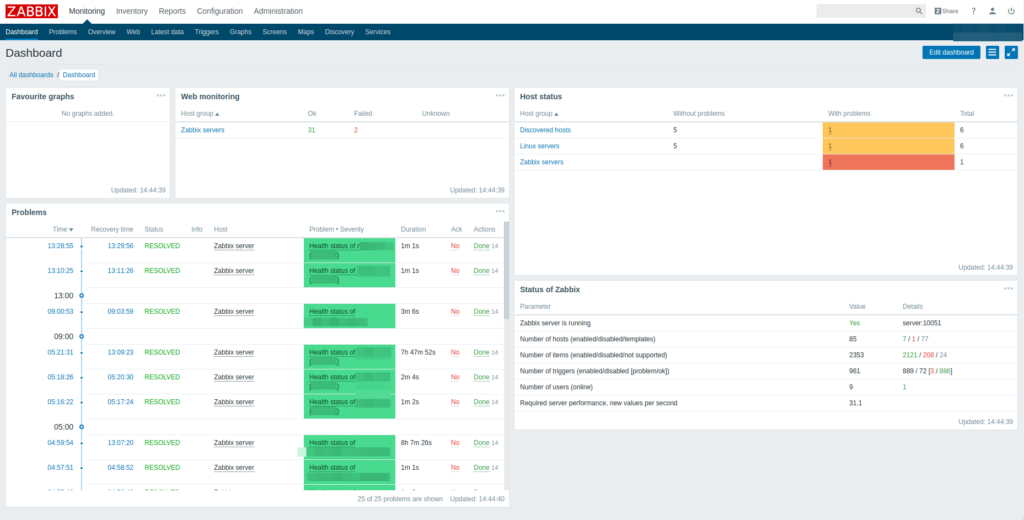
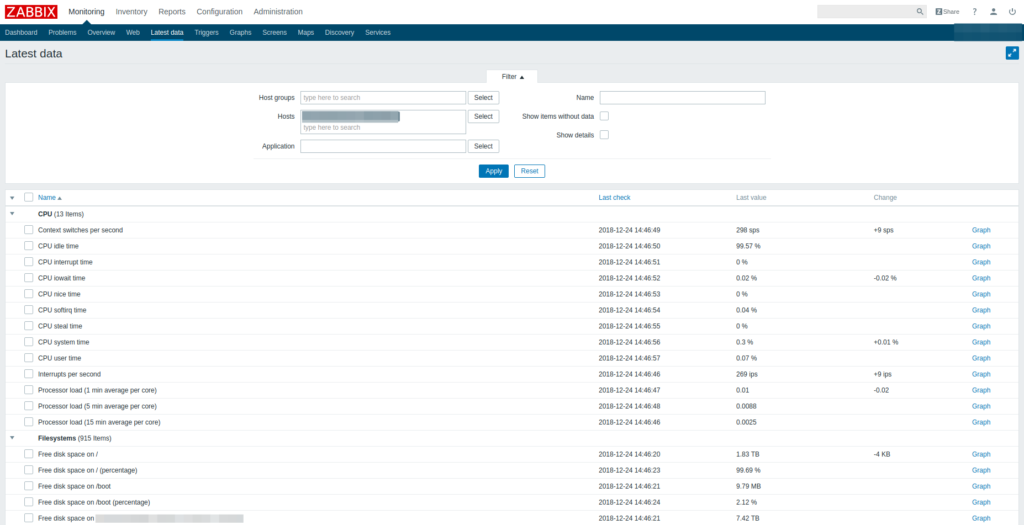
On the part of the public infrastructure of https://onix-systems.com/, we use independent Zabbix monitoring servers with installed Zabbix agents on monitored application servers.
At the moment, the main features of the Zabbix package is a multi-functional monitoring system, which has everything to fully monitor the IT infrastructure of the enterprise, including monitoring the network, servers, and applications.
Setup of Zabbix Servers and Zabbix Agents automated using Ansible and Docker. You can see in it our open repository
